Health Check Management
The Health Check module provides a real-time overview of the system's operational status. It enables administrators to monitor the health and responsiveness of critical infrastructure components, such as database connections and caching services, ensuring the application remains available and performs optimally.
SPS Customizations
Below are the specific workflows and functionalities built into the Health Check module.
1. Health Check Interface
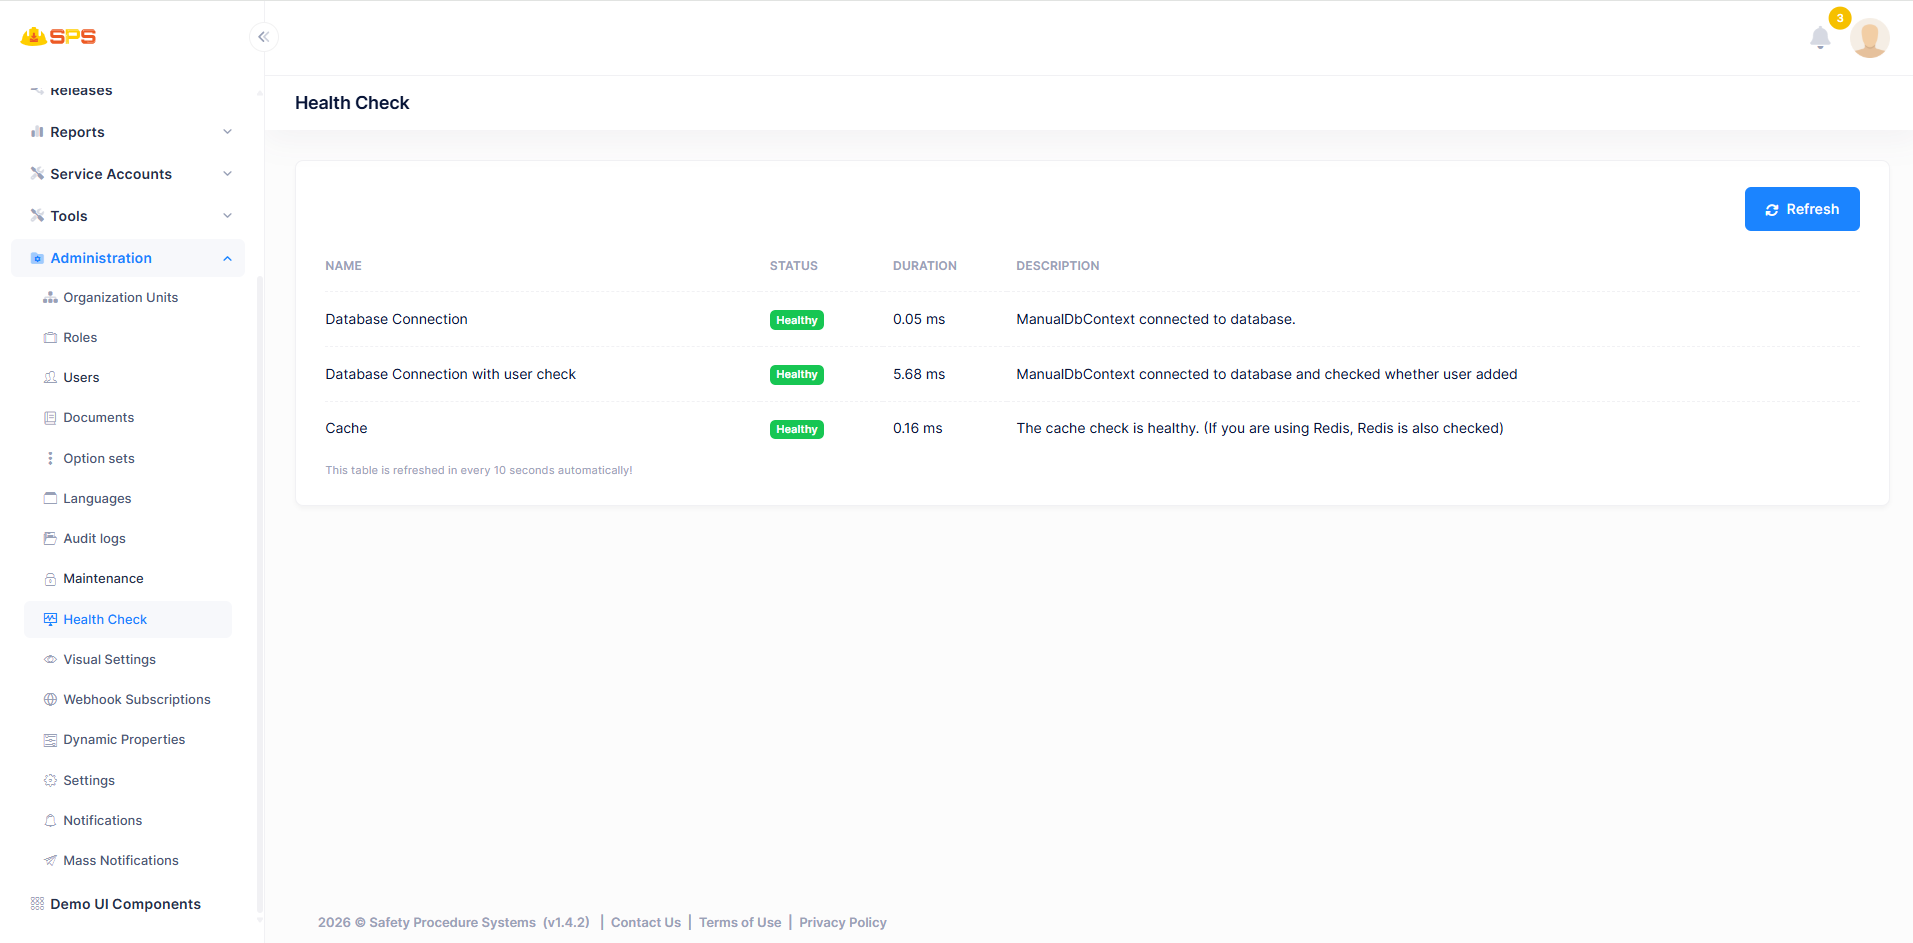
The primary view consists of a status table that monitors key system components:
- Status Table: Displays a list of infrastructure checks with the following details:
- Name: The component being checked (e.g.,
Database Connection,Database Connection with user check,Cache). - Status: A visual indicator of the component's current health (e.g., a green
Healthybadge). - Duration: The time taken (in milliseconds) to perform the health check, helping identify potential performance bottlenecks.
- Description: A brief explanation of the check performed (e.g., verifying
ManualDbContextconnectivity or Redis availability).
- Name: The component being checked (e.g.,
- Auto-Refresh: The status table is designed to automatically refresh every 10 seconds, providing continuous real-time monitoring without manual intervention.
- Manual Refresh: A primary action button (
Refresh) at the top right allows administrators to force an immediate update of all health checks.
Developer Reference
Core Backend Components
- Health Check Services: Integrates with ASP.NET Core's built-in Health Checks middleware (
Microsoft.Extensions.Diagnostics.HealthChecks) to register and execute diagnostic tests for the database (ManualDbContext) and the caching layer. - Application Services: The associated application service aggregates the results from the underlying health checks, formatting the status, duration, and descriptions to be consumed by the frontend interface.