Dashboard & Widget Engine
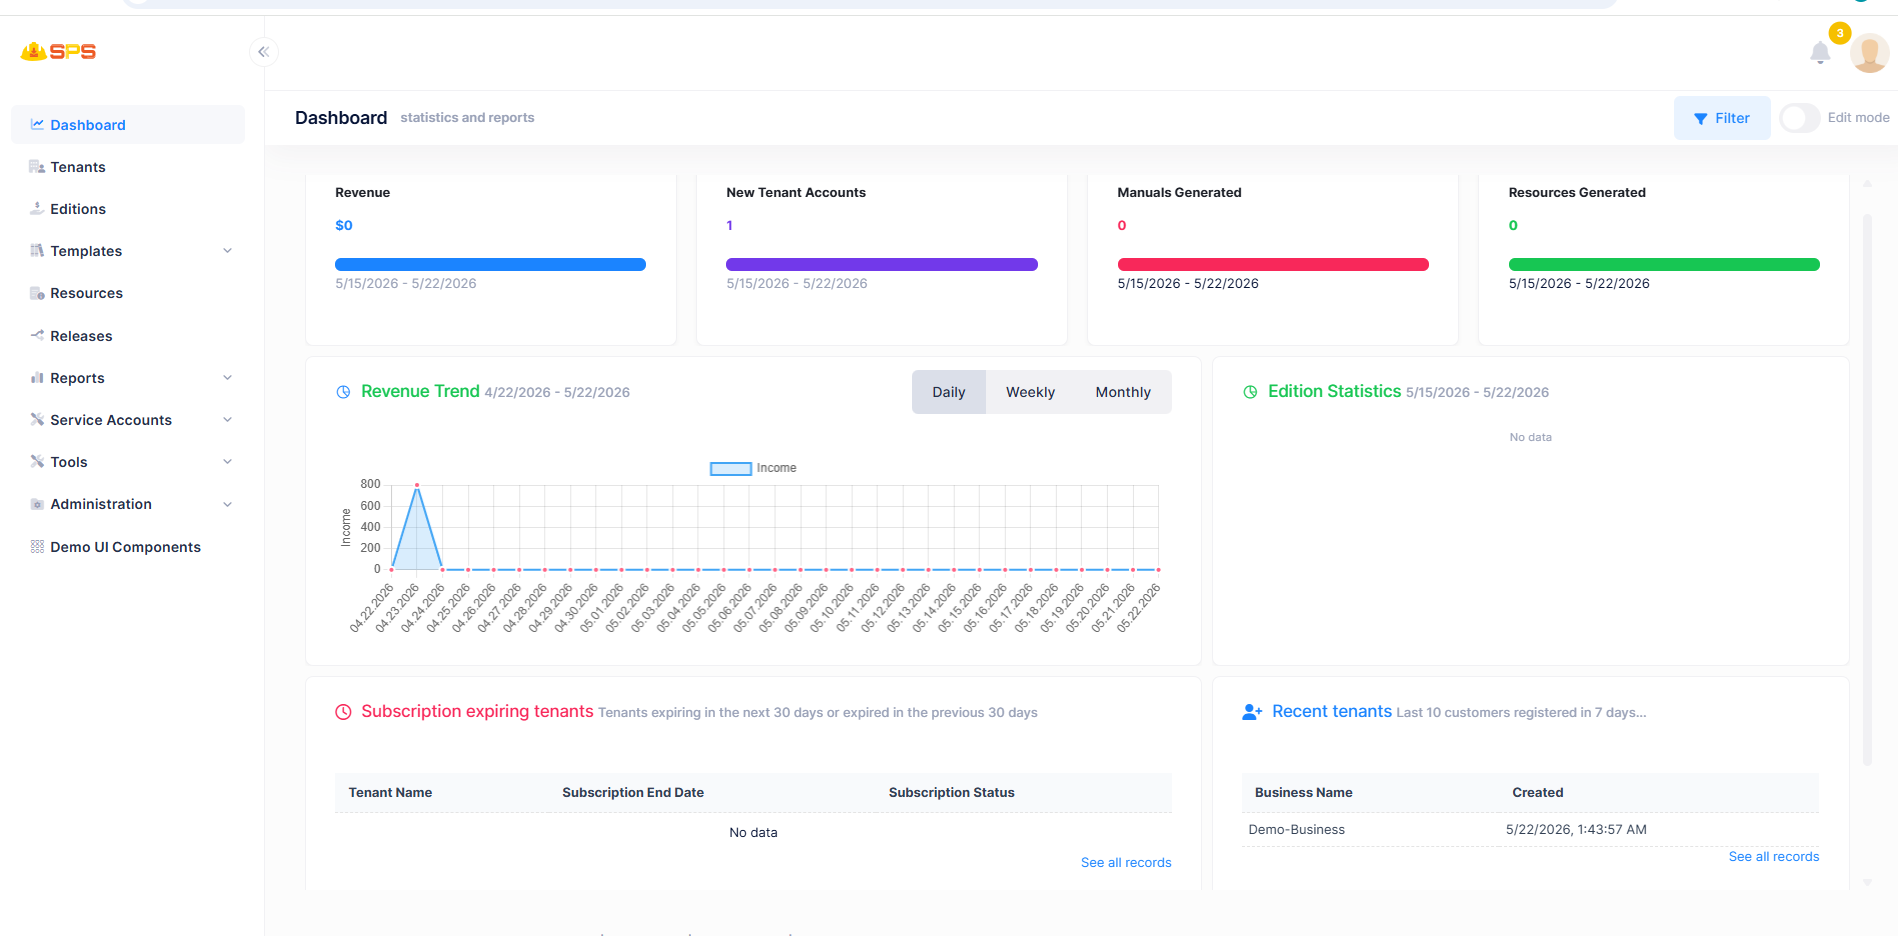
The SPS Dashboard is a high-performance, fully customizable analytics engine powered by Angular Gridster2. It provides real-time visibility into platform health, tenant activity, and revenue metrics.
Technical Architecture
The dashboard is built on a modular "Widget" framework that allows for extreme flexibility.
1. Customizable Engine
- Component:
CustomizableDashboardComponent - Library: Uses
angular-gridster2for drag-and-drop and resizable layouts. - Persistence: User-defined layouts are saved to the backend, allowing every administrator to have a unique workspace.
- Edit Mode: Admins can toggle "Edit Mode" to modify the layout, add new widgets from a library, or delete unnecessary ones.
2. Widget Communication
- Cross-Widget Filters: The dashboard uses a global event system. When the Date Range Picker is updated, it broadcasts an event that all active widgets subscribe to, triggering a data refresh.
- Responsive Charts: Integrated with
ngx-chartsandChart.js, widgets listen for resize events from the Gridster engine to ensure visualizations remain sharp and well-proportioned.
Host Dashboard (System-Wide)
The Host view is designed for global platform monitoring and includes the following key widgets:
1. Host Top Stats
Four high-impact KPI cards displaying:
- New Subscription Amount: Total revenue from new registrations in the filtered period.
- New Tenants: The count of newly onboarded organizations.
- Created Manuals: Cumulative count of manuals managed by the system.
- Compiled Resources: Volume of document processing activity.
2. Income Statistics
A multi-scale line chart visualizing revenue trends. Developers can toggle between Daily, Weekly, and Monthly intervals to analyze growth cycles.
3. Edition Statistics
A distribution pie chart showing the percentage of tenants assigned to each subscription tier (Standard, Enterprise, etc.), aiding in product-market fit analysis.
4. Recent Tenants
A data table displaying the most recently onboarded organizations (defaulting to the last 7 days).
5. Expiring Tenants
A monitoring widget that tracks tenants whose subscriptions are set to expire within the next 30 days. It integrates directly with the Stripe API to fetch and display the real-time payment status (e.g., Active, Canceled, Past due) of each tenant's subscription.
Tenant Dashboard (Organizational)
When logged in as a tenant, the dashboard focuses on internal operational metrics:
1. Tenant Top Stats
- Total Profit: Organizational revenue metrics.
- New Feedbacks: Customer engagement and review volume.
- New Orders/Users: Growth metrics for internal staff and transactional volume.
2. Operational Widgets
- Regional Stats: Geographic distribution of organizational activity.
- Member Activity: Engagement tracking for the tenant's user base.
- Daily Usage: Bar charts showing day-to-day interactions with the platform's core modules.
Developer Reference
- Core Logic:
angular/src/app/shared/common/customizable-dashboard/ - Widget Configuration:
DashboardCustomizationConsts.ts - Backend Services:
HostDashboardAppServiceandTenantDashboardAppService - Data Source: Metrics are primarily derived from the
SpsManualDashboarddata schema.